Use Grafana Data Source Plugin for Observations
This document describes how to install the Data Source plugin for Grafana and set it up to observe Chaos Mesh events.
This plugin requires Chaos Mesh >= 2.1 and Grafana >= 10.0.
We have only tested the plugin on Grafana 10.0.3. It may support lower versions, but we are not sure. The upgrade to Grafana v10 is due to the Angular support deprecation. If you encounter any problems, please open an issue to let us know.
Installation
With the Grafana dashboard
https://grafana.com/docs/grafana/latest/administration/plugin-management/#install-a-plugin
With the CLI
grafana-cli plugins install chaosmeshorg-datasource
Manual installation
Download the plugin zip package using the following command, or go to https://github.com/chaos-mesh/datasource/releases to download it:
curl -LO https://github.com/chaos-mesh/datasource/releases/download/v3.0.0/chaosmeshorg-datasource-3.0.0.zip
After downloading, unzip:
unzip chaosmeshorg-datasource-3.0.0.zip -d YOUR_PLUGIN_DIR
To find the plugin directory, refer to https://grafana.com/docs/grafana/latest/plugins/installation/#install-a-packaged-plugin.
Then update and save the grafana.ini file:
[plugins]
  allow_loading_unsigned_plugins = chaosmeshorg-datasource
To find the configuration file, refer to https://grafana.com/docs/grafana/latest/administration/configuration/#config-file-locations.
Finally, restart Grafana to load the plugin.
Setup
Once installed, go to Administration -> Data sources and add Chaos Mesh, then go to the configuration page:
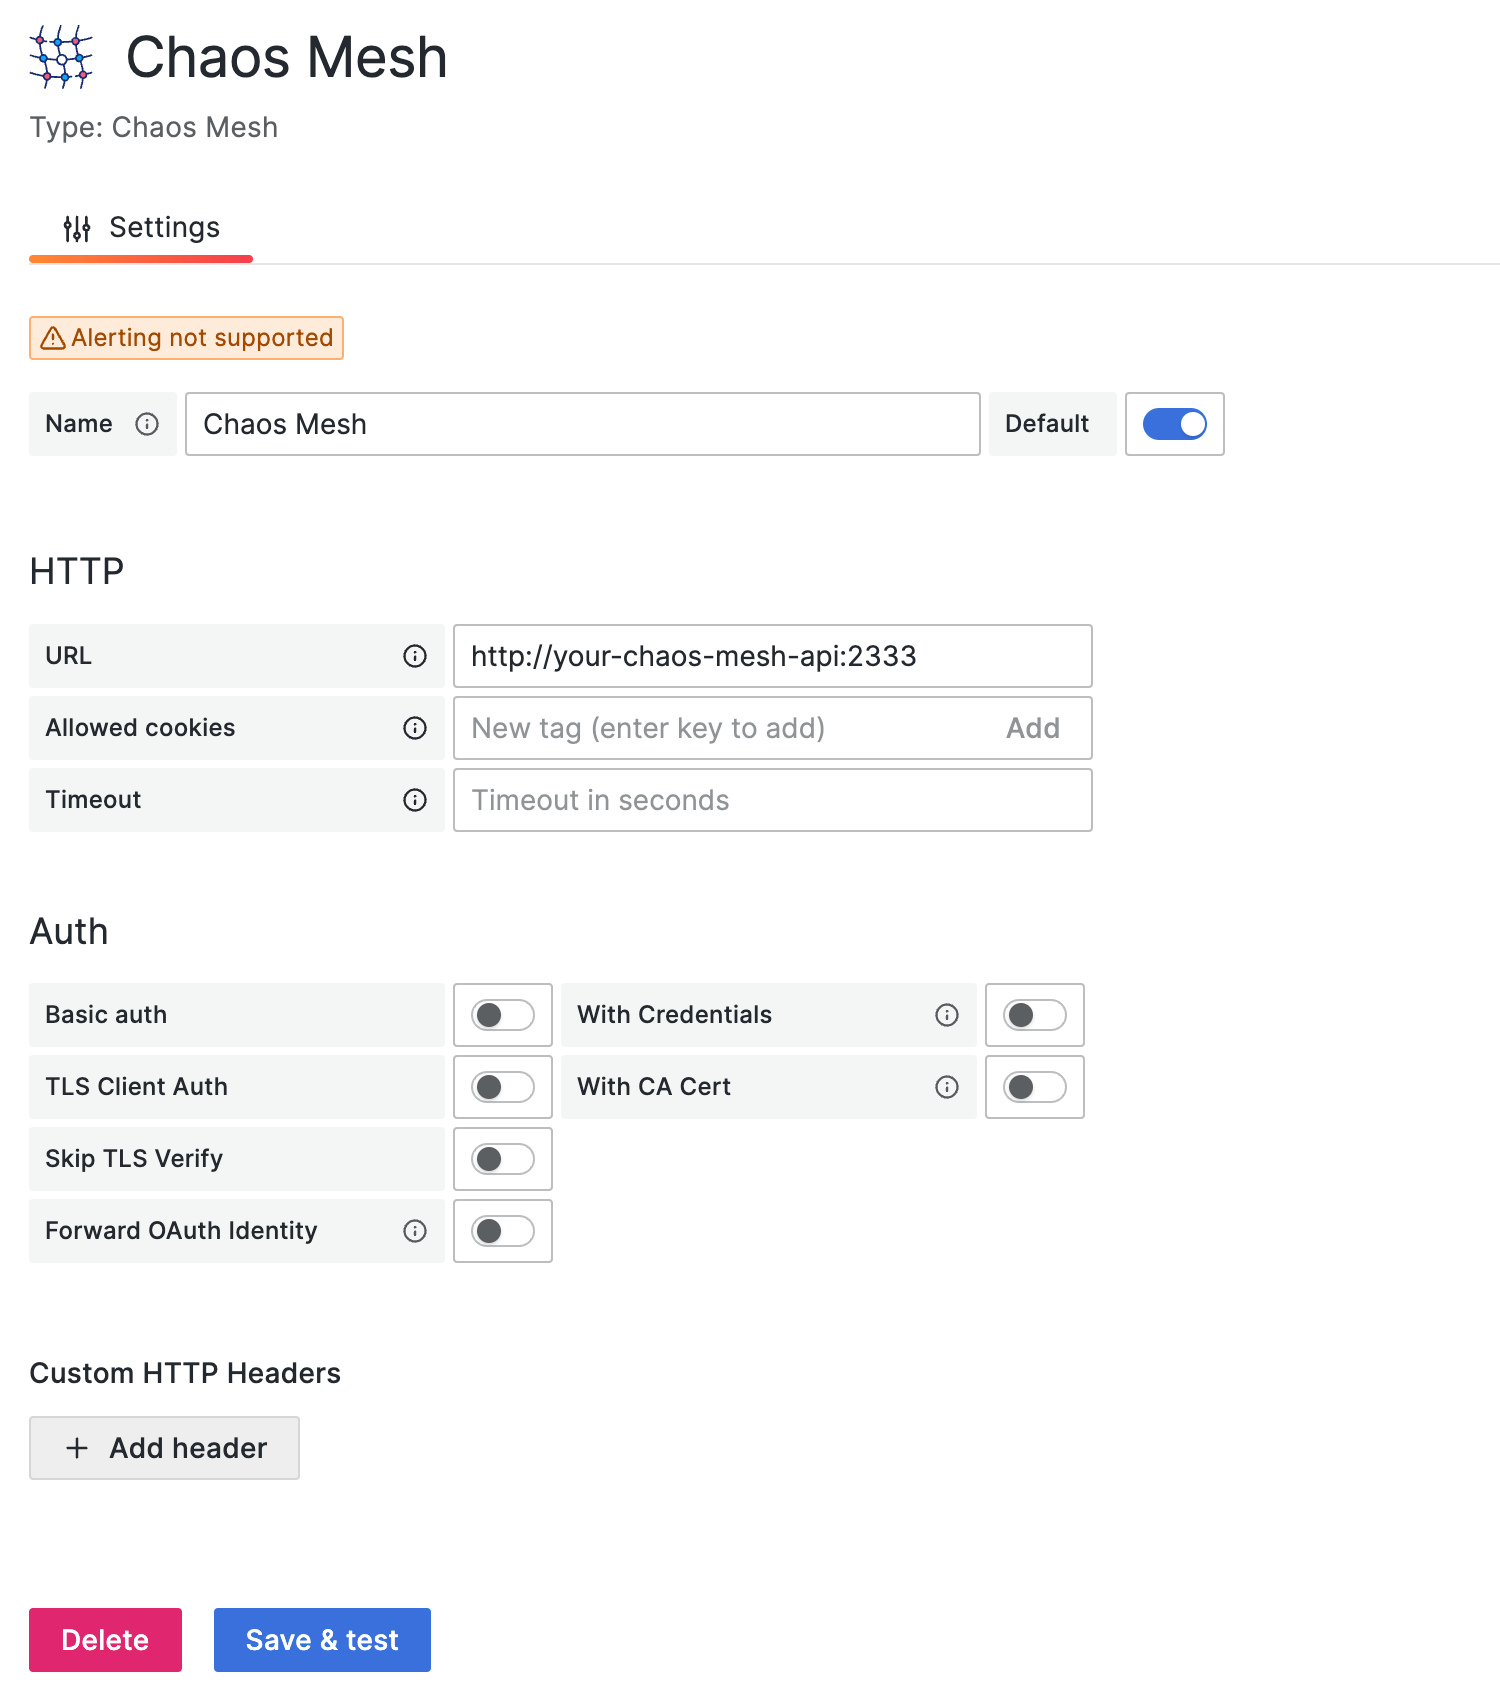
Assuming you have Chaos Mesh installed locally, Chaos Dashboard exposes the API on port 2333 by default. If you haven't changed anything, fill in http://localhost:2333.
Then use the port-forward command to make the API externally accessible:
kubectl port-forward -n chaos-mesh svc/chaos-dashboard 2333:2333
Finally, click Save & test to test the connection. If it shows a successful notification, the setup is complete.
Authentication
If you deploy Chaos Mesh with permission authentication, you need to add the Authorization header to the configuration. You can follow the steps below to add the header:
- Click the Add header button.
- Fill in the
Authorizationin the Header field. - Follow this section to get the token.
- Fill in the
Bearer YOUR_TOKENin the Value field.
Then don't forget to click Save & test to test the connection.
Query
The data source plugin looks at Chaos Mesh through the lens of events, and the following options are responsible for filtering the different events:
-
Object ID
Filter by object UUID.
-
Namespace
Filter by namespace.
-
Name
Filter by object name.
-
Kind
Filter by kind (e.g., PodChaos, NetworkChaos, Schedule). You can also input an arbitrary kind if you implement a new kind in Chaos Mesh.
-
Limit
Limit the number of events.
All of them are passed as parameters to the /api/events API.
Variables
The data source plugin supports adding query variables by different metrics:
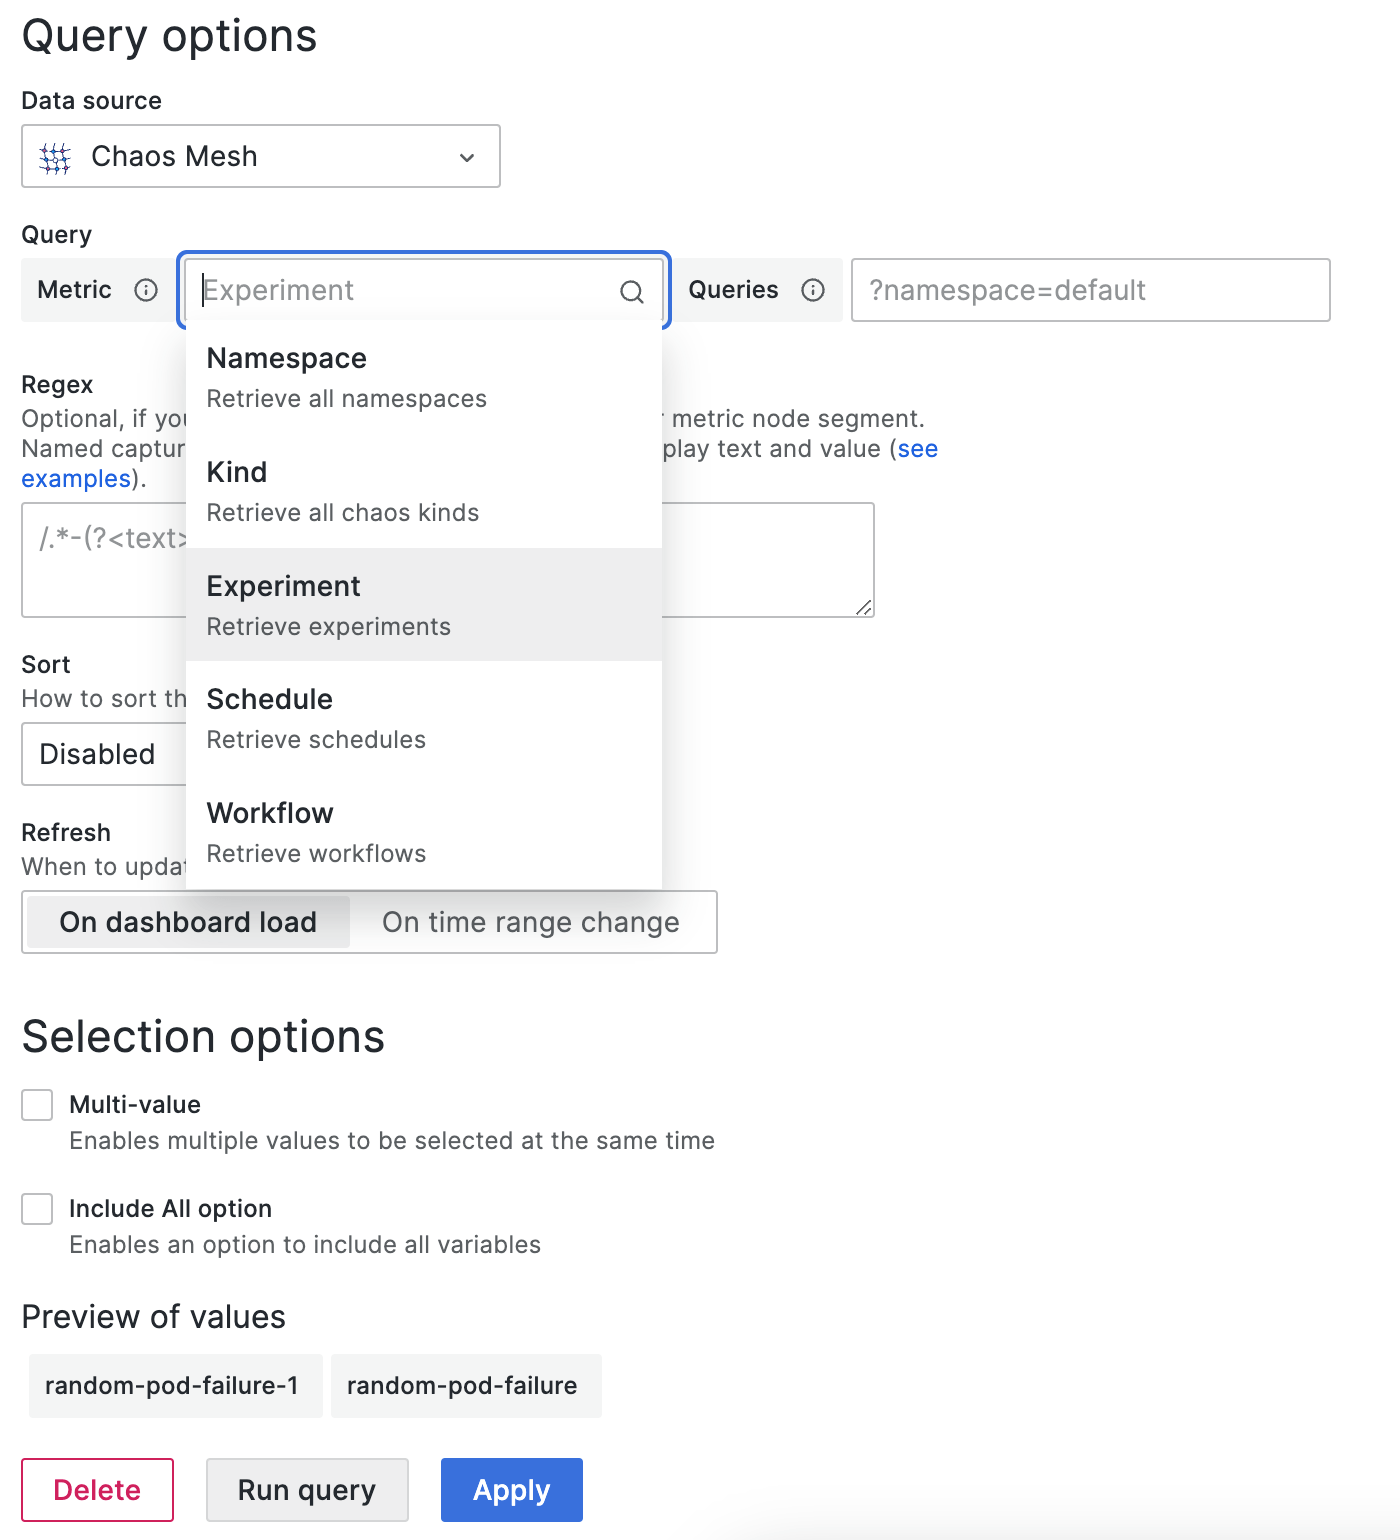
-
Namespace
After selection, all available namespaces are shown in the Preview of values directly.
-
Kind
Same as Namespace. Retrieve all kinds.
-
Experiment/Schedule/Workflow
Same as Namespace. Retrieve all current experiments/schedules/workflows.
You can also specify the
queriesto further filter the values, for example,?namespace=defaultwill only retrieve the experiments/schedules/workflows in thedefaultnamespace.
Annotations
You can integrate events into panels via annotations. The following is a sample annotation that retrieves all PodChaos events:
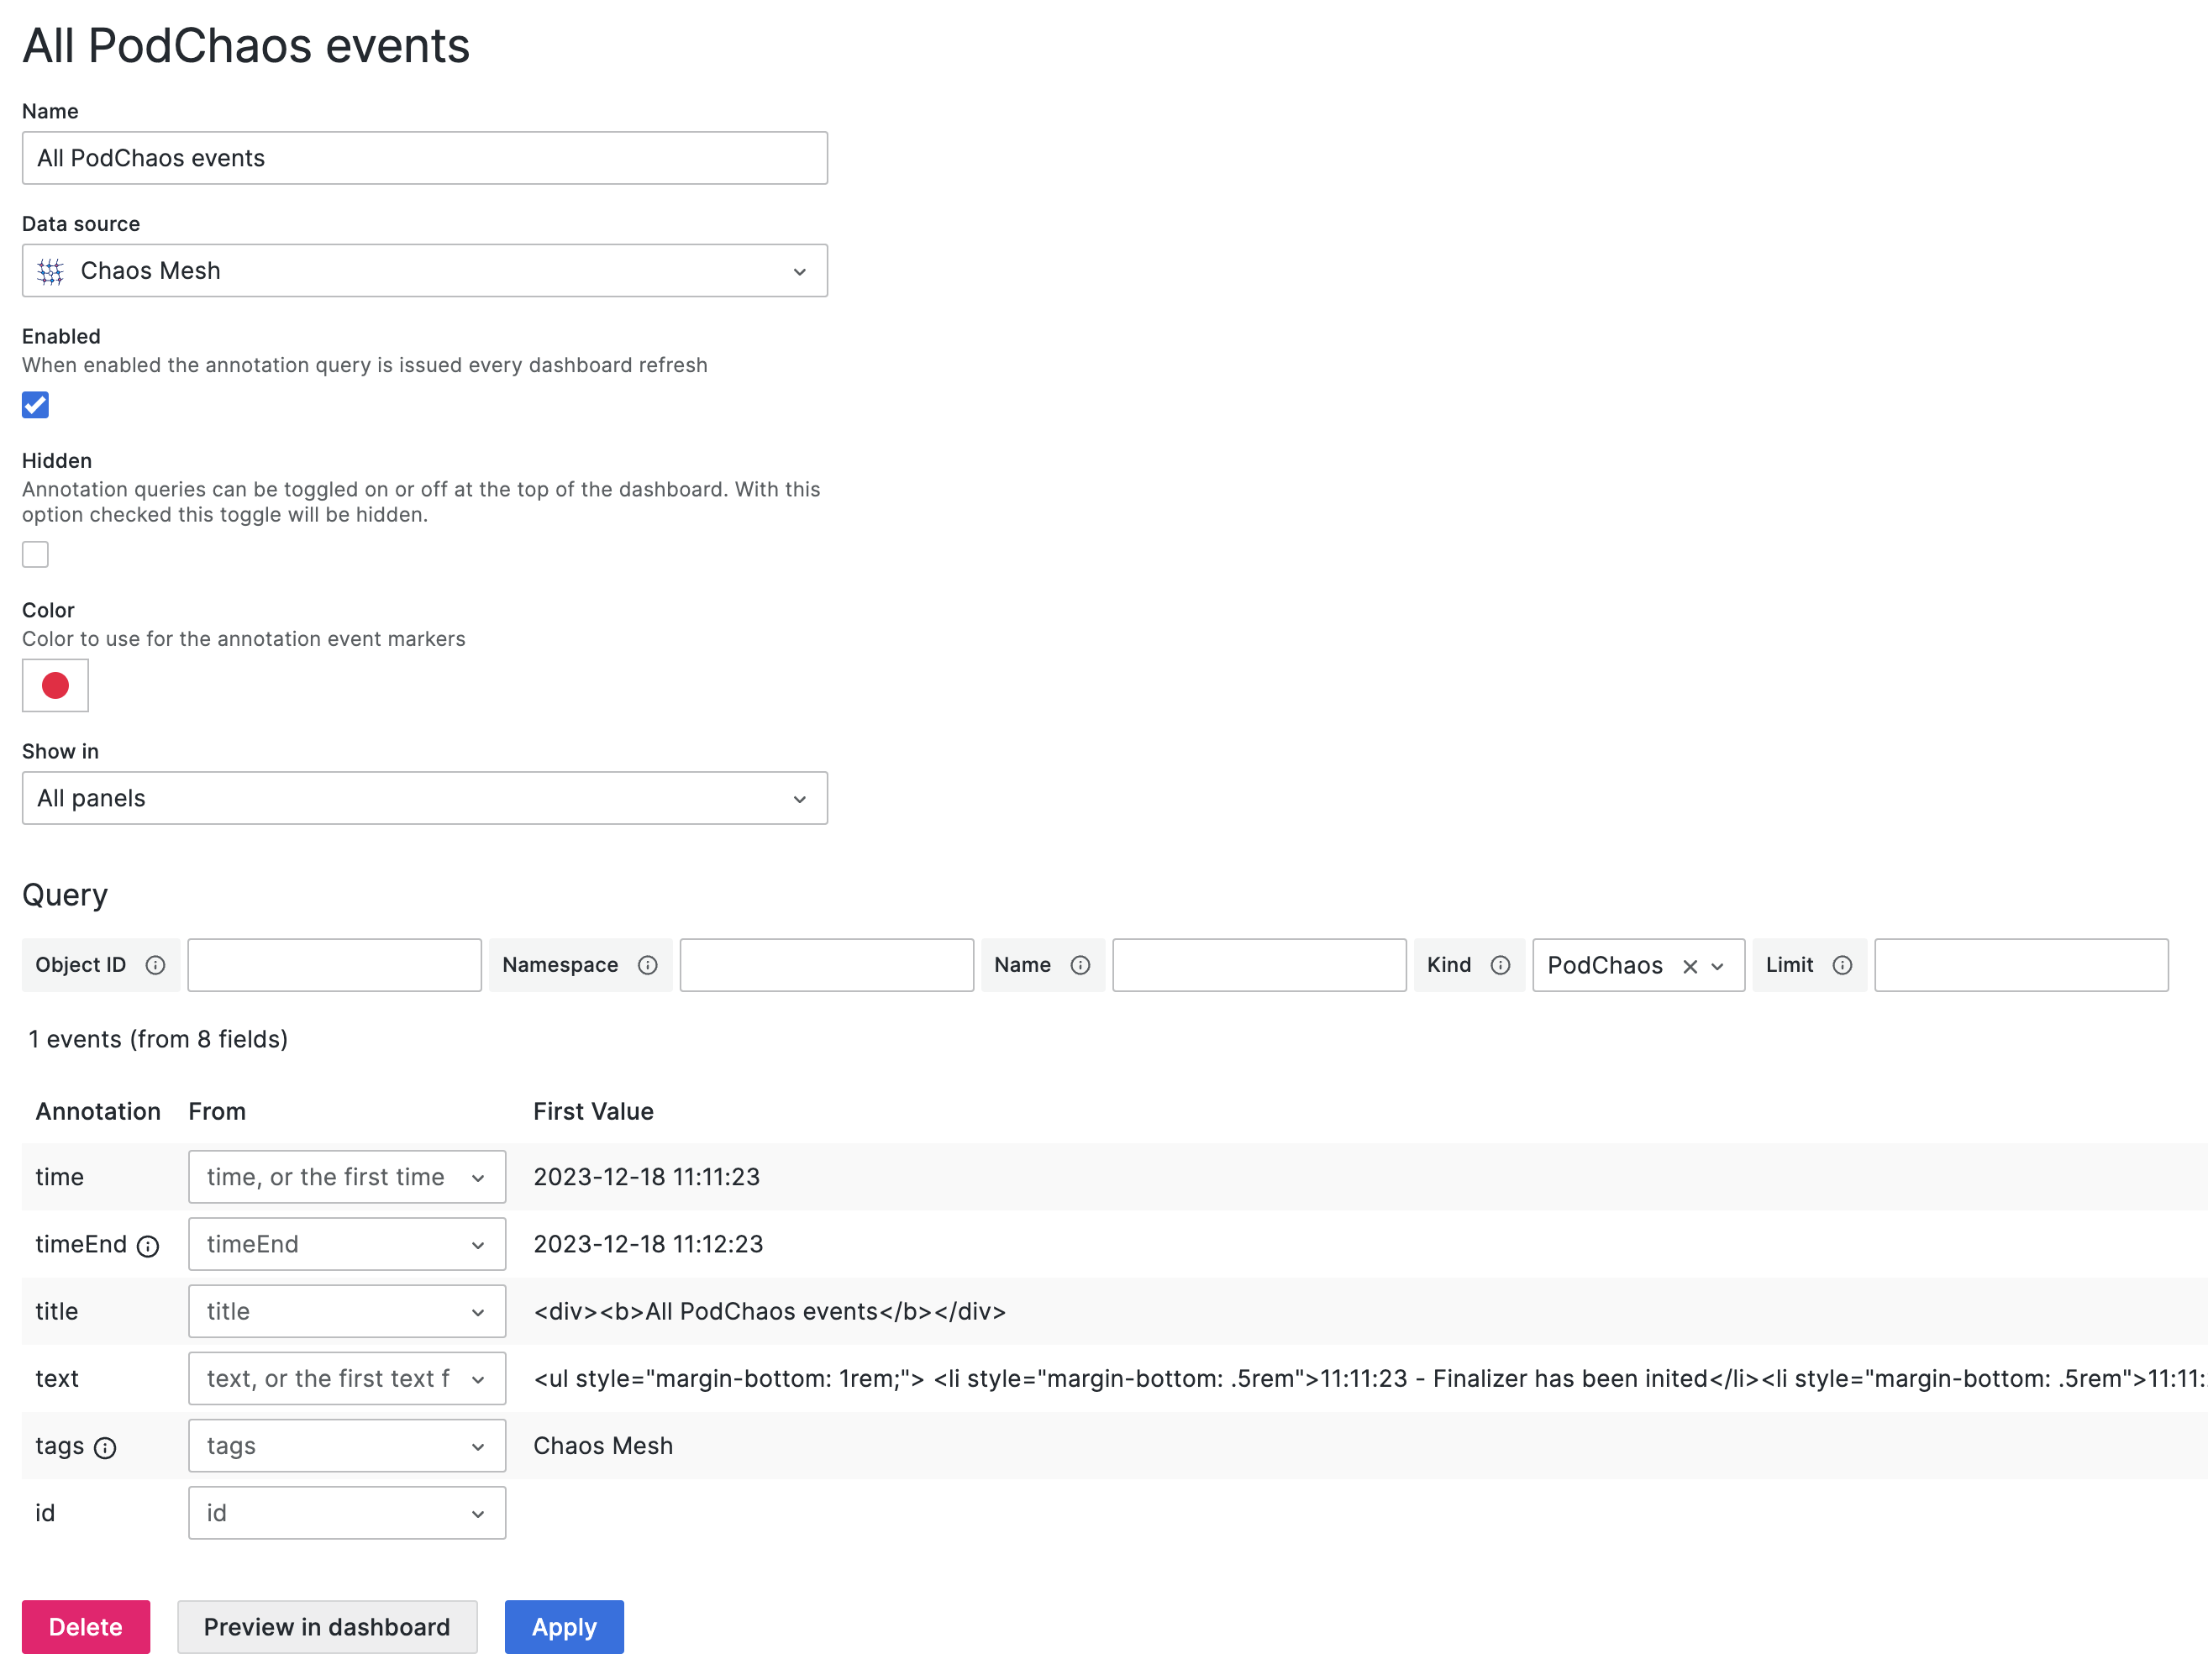
Please refer to Query to fill in the corresponding fields.
Questions and feedback
If you encounter problems during installation or setup, you are welcome to ask the community at CNCF Slack, or create a GitHub issue to communicate with the Chaos Mesh team.
What's next
If you want to learn more details about the Data Source plugin, feel free to check out the source code at chaos-mesh/datasource.