How to Develop a Daily Reporting System to Track Chaos Testing Results


Chaos Mesh is a cloud-native chaos engineering platform that orchestrates chaos experiments on Kubernetes environments. It allows you to test the resilience of your system by simulating problems such as network faults, file system faults, and Pod faults. After each chaos experiment, you can review the testing results by checking the logs. But this is neither direct nor efficient. Therefore, I decided to develop a daily reporting system that would automatically analyze logs and generate reports. This way, it’s easy to examine the logs and identify the issues.
In this article, I will give you some insights about how to build a daily reporting system, as well as the problems I encountered during the process and how I fixed them.
Deploy Chaos Mesh on Kubernetes
Chaos Mesh is designed for Kubernetes, which is one of the important reasons why it can allow users to inject faults into the file system, Pod, or network for specific applications.
In earlier documents, Chaos Mesh offered two ways to quickly deploy a virtual Kubernetes cluster on your machine: kind and minikube. Generally, it only takes a one-line command to deploy a Kubernetes cluster as well as install Chaos Mesh. But there are some problems:
- Starting Kubernetes clusters locally affects network-related fault types.
- Users on the Chinese mainland might experience an extremely slow process to pull the Docker image or even a timeout.
If you use the provided script to deploy a Kubernetes cluster using kind, all Kubernetes nodes are virtual machines (VM). This adds difficulty when you pull the image offline. To address this issue, you can deploy the Kubernetes cluster on multiple physical machines instead, with each physical machine acting as a worker node. To expedite the image pulling process, you can use the docker load command to load the required image in advance. Apart from the two problems above, you can install kubectl and Helm by following the documentation.
Note: For the latest installation and deployment instructions, refer to Chaos Mesh Quick Start.
Deploy TiDB
The next step is to deploy TiDB on Kubernetes. I used TiDB Operator to streamline the process. For details, check out Get started with TiDB Operator in Kubernetes.
I’d like to highlight two points in this process:
- First, install Custom Resource Definitions (CRDs) to implement different components of TiDB Operator. Otherwise, you’ll get errors when you try to install TiDB Operator.
- Use Longhorn, a distributed block storage system for Kubernetes, to create local persistent volumes (PV) for your Kubernetes cluster. This way, you don’t have to create PVs in advance: whenever a Pod is pulled, a PV is automatically created and mounted.
The biggest problem that I encountered was that pulling the image could be extremely slow when deploying the service. If the nodes in your Kubernetes cluster are virtual machines, pull the required images in advance and load them to the Docker of each machine:
## Pull required images on a machine with a good network connection
docker pull pingcap/tikv:latest
docker pull pingcap/tidb:latest
docker pull pingcap/pd:latest

## Export images and save them to each machine in the Kubernetes cluster
docker save -o tikv.tar pingcap/tikv:latest
docker save -o tidb.tar pingcap/tidb:latest
docker save -o pd.tar pingcap/pd:latest

## Load images to each machine
docker load < tikv.tar
docker load < tidb.tar
docker load < pd.tar
The above commands allow you to use the TiDB image in the local Docker registry to deploy the latest TiDB cluster, saving you the trouble of pulling the image from the remote repository. The idea also applies to the Chaos Mesh installation as described earlier. If you do not know which images you need to pull, install Chaos Mesh using Helm to trigger the installation process, then use the kubectl describe command to verify:
## Check pods that are deployed in a specific namespace.
kubectl describe pods -n tidb-test
The mirror pulling process usually takes the longest time to complete. If the Pod is being scheduled to a node, check it later.
Run a chaos experiment
To run a chaos experiment, you have to define it first through YAML files and use kubectl apply to start it. In this example, I created a chaos experiment using PodChaos to simulate a Pod crashing. For detailed instructions, refer to Run a Chaos Experiment.
Generate daily report
Collect logs
Usually, when you run chaos experiments on TiDB clusters, many errors are returned. To collect those error logs, run the kubectl logs command:
kubectl logs <podname> -n tidb-test --since=24h >> tidb.log
All logs generated in the past 24 hours of the specific Pod in the tidb-test namespace will be saved to the tidb.log file.
Filter errors and warnings
In this step, you have to filter error messages and warning messages from logs. There are two options:
- Use text processing tools, such as awk. This requires a proficient understanding of Linux/Unix commands.
- Write a script. If you’re not familiar with Linux/Unix commands, this is the better option.
Draw a plot
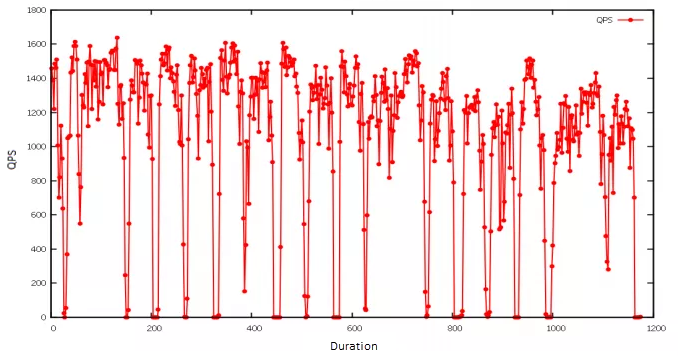
For plotting, I used gnuplot, a Linux command-line graphing utility. In the example below, I imported the pressure measurement results and created a line graph to show how queries per second (QPS) were affected when a specific Pod became unavailable. Since the chaos experiment was executed periodically, the number of QPS exhibited a pattern: it would drop abruptly and then quickly return to normal.
Generate the report in PDF
Currently, there is no available API for generating Chaos Mesh reports or analyzing results. I decided to generate the report in PDF format so it would be readable on different browsers. In my case, I used gopdf, a support library that allows users to create PDF files. It also lets me insert images or draw tables, which meets my needs.
To generate a daily report, I used crond, a command-line utility that executes cron jobs in the background, to execute the commands early each morning. So, when I start work, there is a daily report waiting for me.
Build a web application for daily reporting
But I want to make the report more readable and accessible. Isn’t it nicer if you can check reports on a web application? At first, I wanted to add a backend API and track when the report was generated. It sounds applicable but it may be too much work since all I want is to know which report requires further troubleshooting. The exact information is shown in the file name, for example: report-2021-07-09-bad.pdf. Thus, the reporting system’s workload and complexity are greatly reduced.
Still, it is necessary to improve the backend interfaces as well as enrich the report content. But for now, a daily, workable reporting system is just fine.
In my case, I used Vue.js to scaffold the web application using a UI library antd. After that, I updated the page content by saving the automatically generated report to the static resources folder static. This allows the web application to read the static reports and then render them to the front end page. For details, check out Use antd in vue-cli 3.
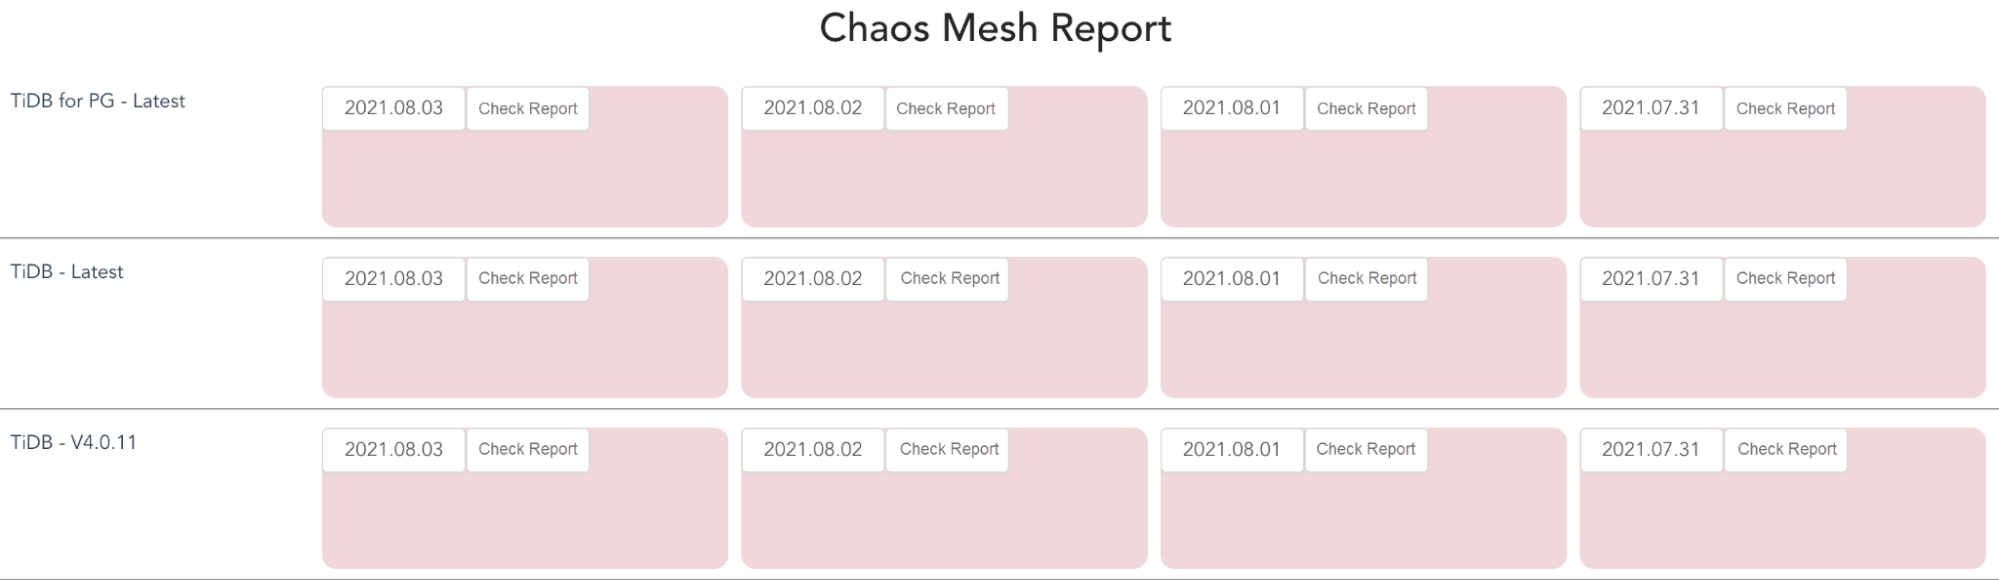
Below is an example of a web application that I developed for daily reporting. The red card indicates that I should take a look at the testing report because exceptions are thrown after running chaos experiments.
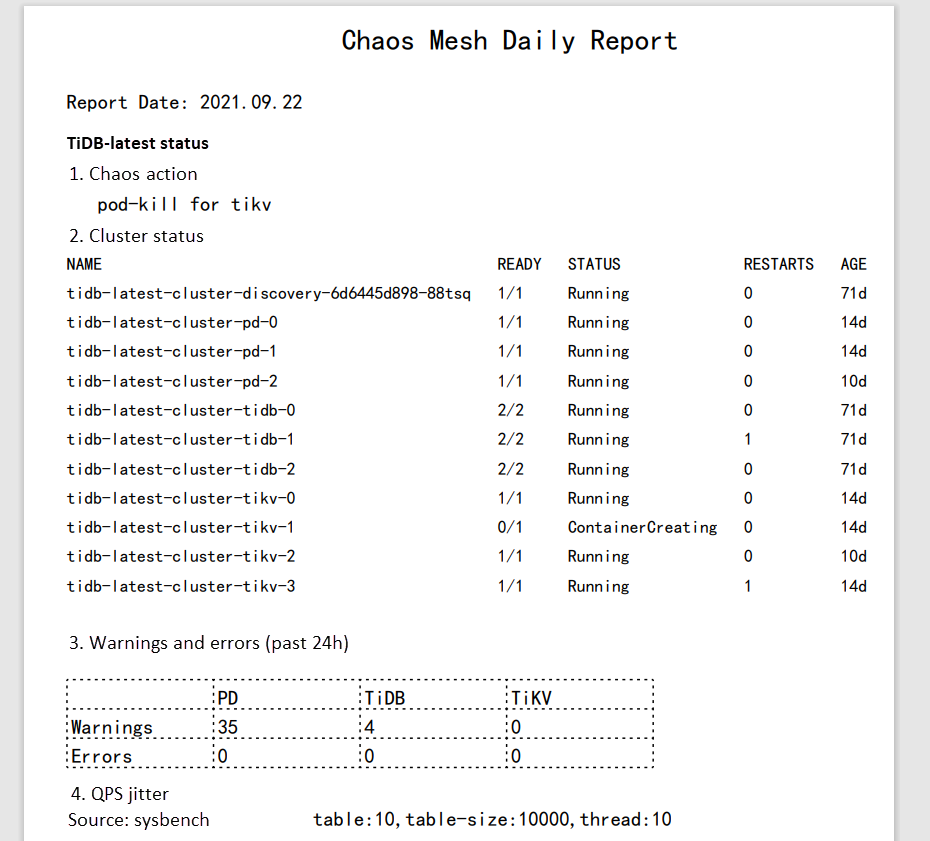
Clicking the red card will open the report, as shown below. I used pdf.js to view the PDF.
Summary
Chaos Mesh enables you to simulate faults that most cloud-native applications might encounter. In this article, I created a PodChaos experiment and observed that QPS in the TiDB cluster was affected when the Pod became unavailable. After analyzing the logs, I can enhance the robustness and high availability of the system. I built a web application to generate daily reports for troubleshooting and debugging. You can also customize the reports to meet your own requirements.
Our team is also working on a project to make TiDB compatible with PostgreSQL. If you are interested and want to make contributions, you are welcome to pick an issue and get started.
Originally published at The New Stack.